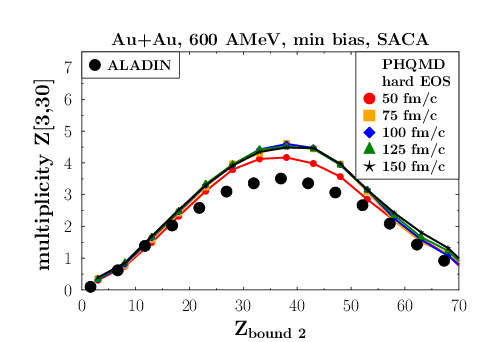
"Rise and fall" of the multiplicity of clusters with Z ∈ [3, 30] as a function of the total bound charge Zbound2. Both quantities are measured for forward emitted clusters. The plot shows the PHQMD results with hard EoS using cluster identification by SACA for 600 AGeV at different times – 50 (red line), 75(orange line), 100 (blue line), 125 (green line), 150 (black line) fm/c.
Paper
Experimental data Experimental data
Paper
Experimental data Experimental data
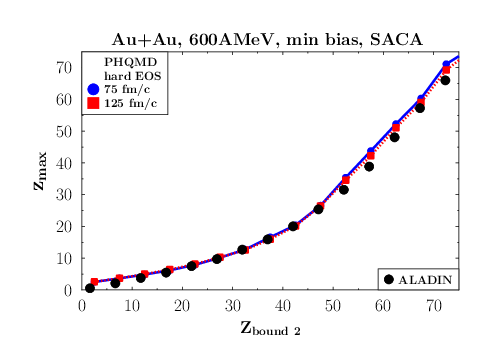
The average charge of the largest cluster as a function of the total bound charge. Both quantities are measured for forward emitted clusters. The PHQMD results with cluster identification by SACA are presented for two times of 75 and 125 fm/c and compared to the ALADIN experimental data.
Paper Experimental data
Paper Experimental data
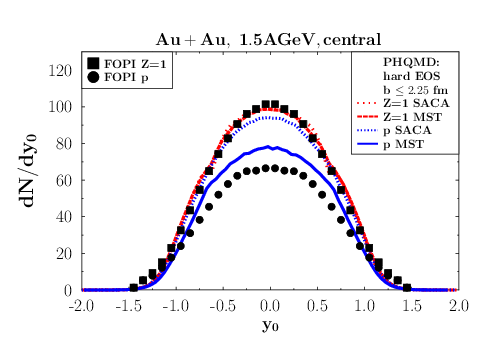
Scaled experimental rapidity distribution, $y_{0} = y/y_{proj}$, of all bound and unbound protons (Z = 1) – solid squares, and free (unbound) protons – solid dots, observed by the FOPI collaboration in central Au+Au collisions at 1.5 AGeV in comparison to the PHQMD results: the rapidity distribution of all bound and unbound protons (Z = 1) after the clusters have been identified by MST (red dotted line) or by SACA (red dashed line); the rapidity distributions of free protons after subtracting the protons bound in clusters identified by MST (blue solid line) or by SACA (blue short dotted line).
Paper Experimental data
Paper Experimental data
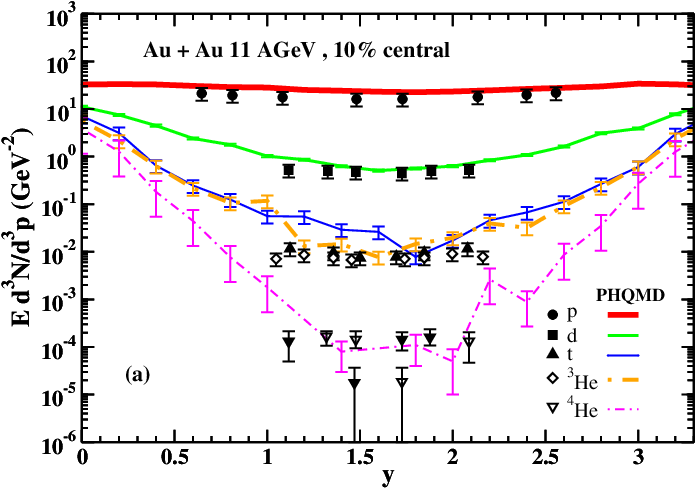
The invariant multiplicities for p, d, t, $^3He$, $^4He$ at $p_T \leq 0.1$ GeV versus rapidity for 10% central Au+Au collisions at Ebeam = 11 AGeV. The solid (dash-dotted) lines with different thickness correspond to the PHQMD calculations with hard EoS for charge value Z = 1 (Z = 2). Clusters are identified by the MST algorithm.
Paper
Experimental data Experimental data
Paper
Experimental data Experimental data
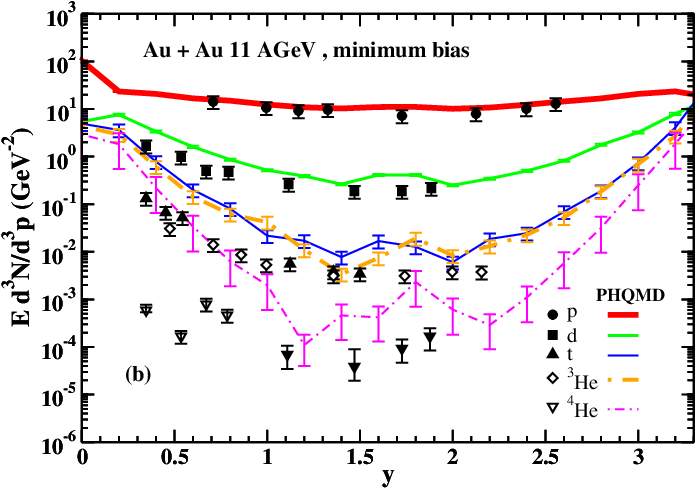
The invariant multiplicities for p, d, t, $^3He$, $^4He$ at $p_T \leq 0.1$ GeV versus rapidity for min.bias collisions at Ebeam = 11 AGeV. The solid (dash-dotted) lines with different thickness correspond to the PHQMD calculations with hard EoS for charge value Z = 1 (Z = 2). Clusters are identified by the MST algorithm.
Paper
Experimental data Experimental data
Paper
Experimental data Experimental data
The compilation of the experimental data on the clusters production used for the PHQMD validation:
| Experiment | System | Energy | Specie | Paper |
|---|---|---|---|---|
| FOPI | Au+Au | $E_{lab}$ = 1.5 A.GeV | d , t | 10.1016/j.nuclphysa.2010.09.008 |
| E802 | Au+Pb | $E_{lab}$ = 10.6 A.GeV | d | 10.1016/j.nuclphysa.2010.09.008 |
| E864 | Au+Pb Au+Pt |
$E_{lab}$ = 10.6 A.GeV | d,t,$^3He$
, $^4He$
Yields $H^3_\Lambda$,$H^4_\Lambda$ |
10.1103/PhysRevC.61.064908
10.1103/PhysRevLett.83.5431 10.1103/PhysRevC.70.024902 |
| E878 + E886 | Au+Au | $E_{lab}$ = 10.6 A.GeV | 10% central: d
,t
,$^3He$
,$^4He$
min.bias: d ,t ,$^3He$ ,$^4He$ |
10.1103/PhysRevC.58.1155 |
| NA49 | Pb+Pb | $P_{lab}$ = 20, 30, 40, 80, 158 GeV/c | d,t,$^3He$ | 10.1103/PhysRevC.94.044906 |
| STAR BES | Au+Au | $\sqrt{s_{NN}}$ = 7.7, 11.5, 19.6, 27, 39, 62.4, 200 GeV | d | 10.1103/PhysRevC.99.064905 |